
Counting Peak Bloom
March 19, 2024
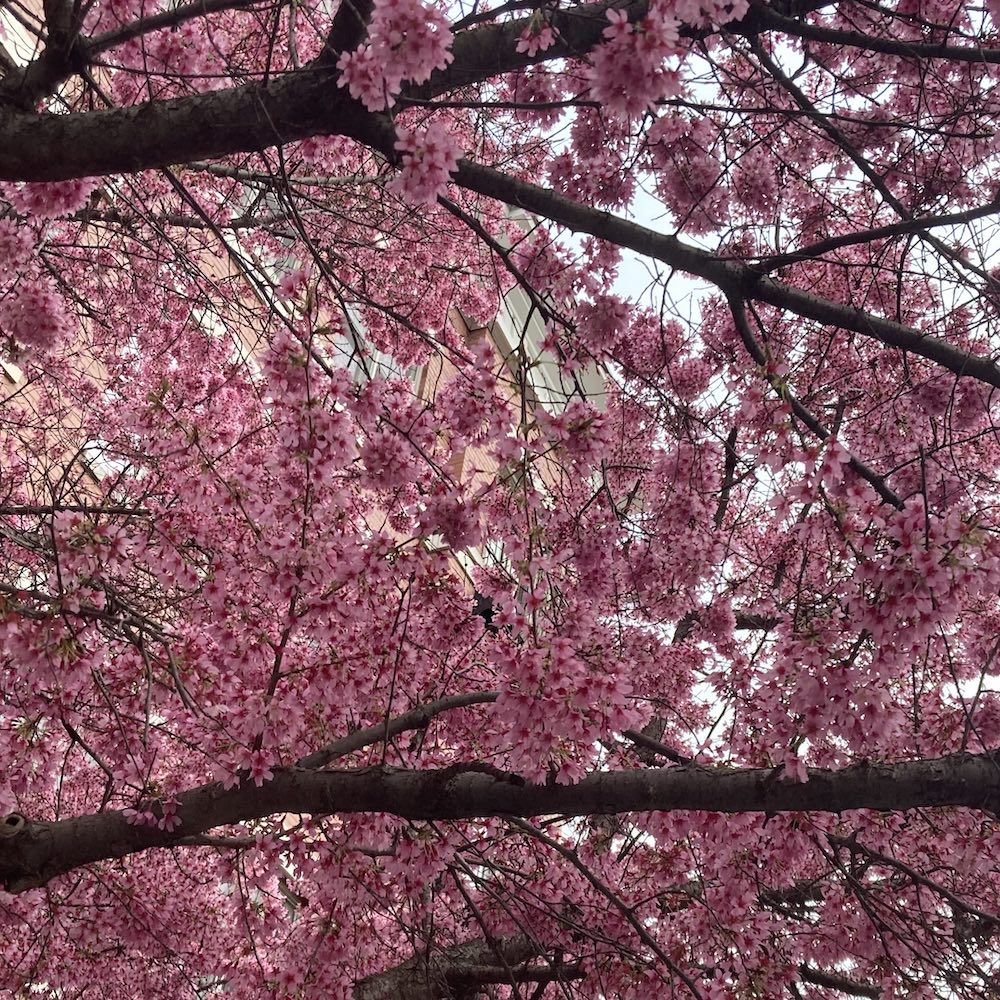
The beauty of D.C.’s cherry blossoms isn’t in the festival, the parade or the hordes of tourists who descend upon the National Mall.
It’s in quietly strolling down a familiar path to the grocery store, suddenly seeing flowers emerge from branches that were barren for months. And more the next day, and the next, until the whole neighborhood is in bloom again.
Then the pollen hits, the flowers fall off to be replaced by leaves and the overwhelming humidity of summer sets in. But for a brief interlude, the streets of your home have never seemed so lovely.
I wanted to see where I should walk to see even more cherry blossoms without the chaos of the Mall. (Don’t get me wrong: the Tidal Basin in bloom is stunning, but much like Times Square on New Year’s Eve it isn’t the scene for everyone.)
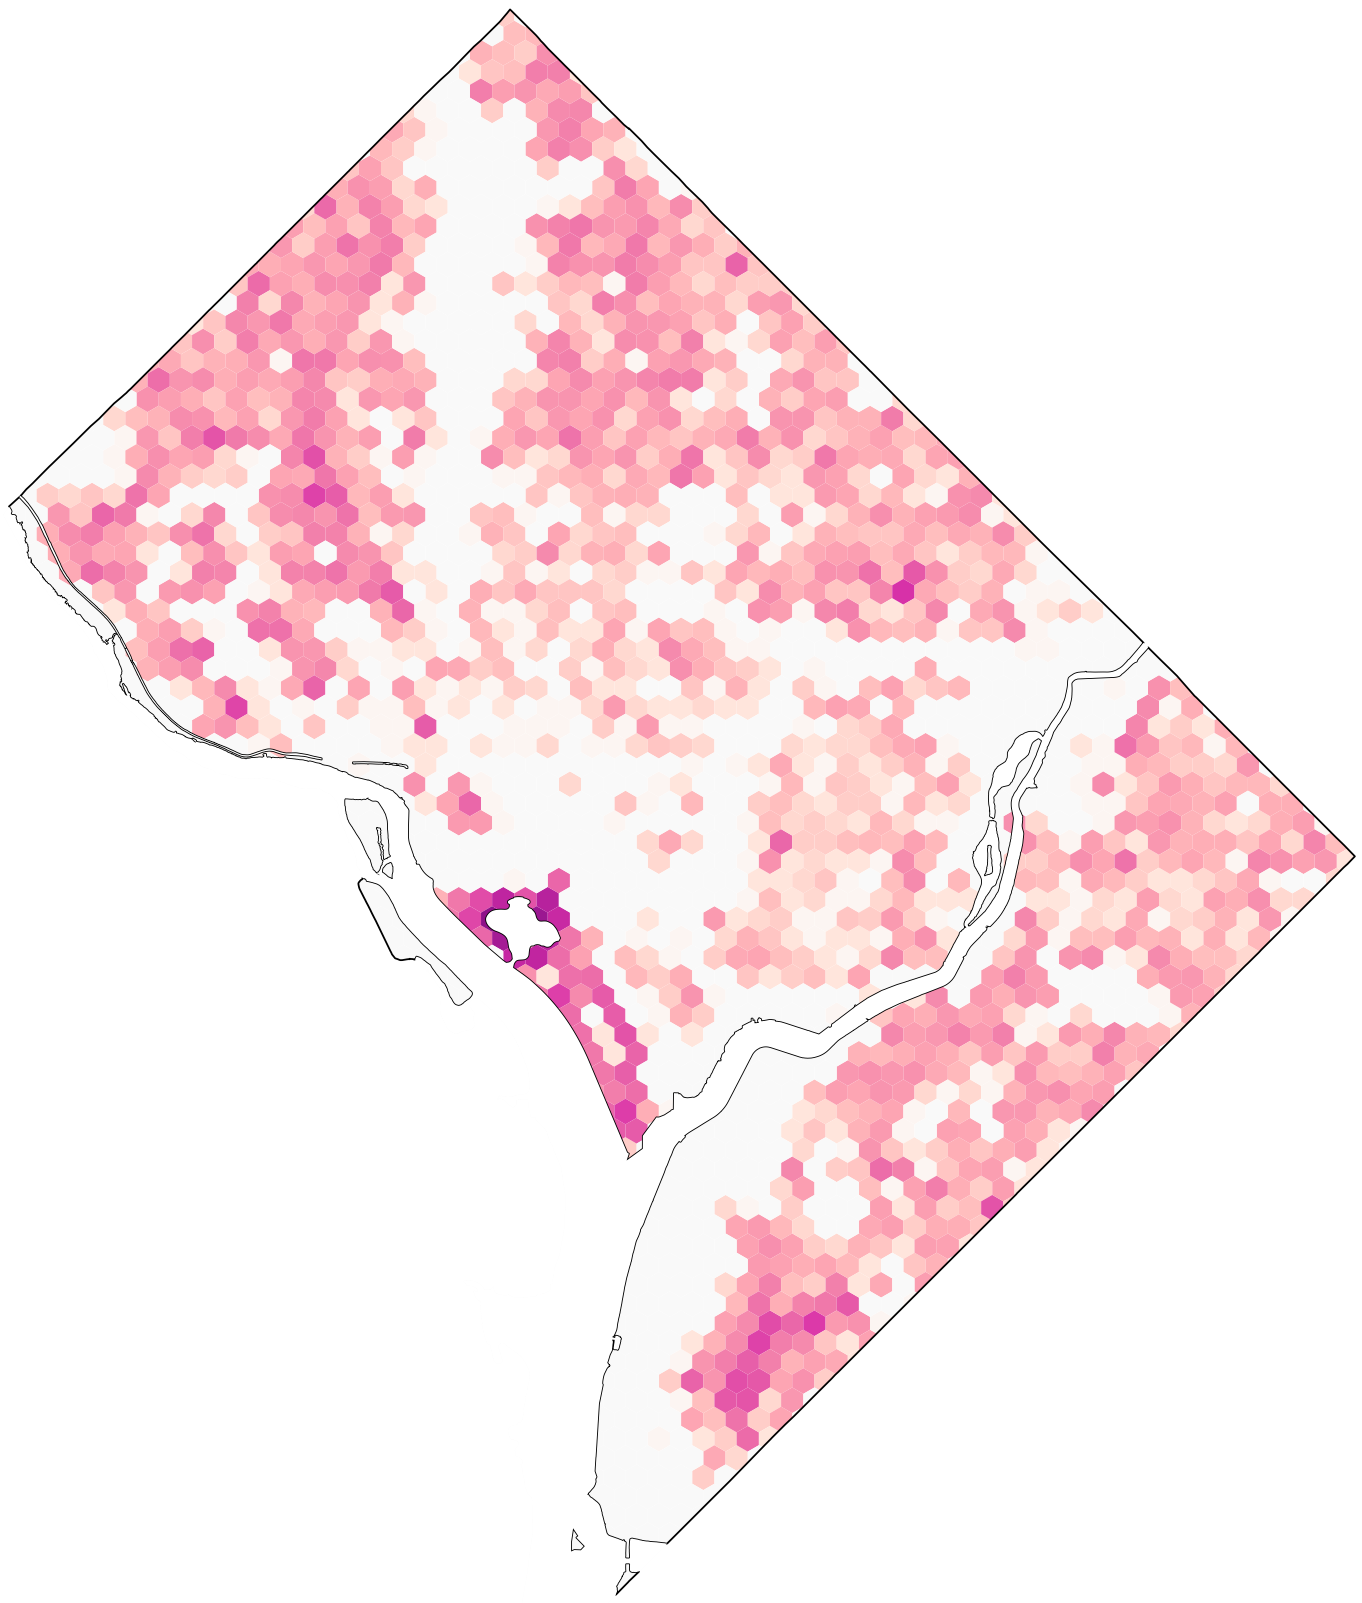
Using data from Casey Trees, I mapped cherry trees across the District to count how many are near any address. Click on your home to find how many you can reach in a half mile radius, or about a ten minute walk.
How Many Trees Can You See Nearby?
Consider this just a starting point, a partial view of the blooms you can find on your next trek to the pharmacy. The data doesn’t include trees planted on private property and some parks. Many of my favorite trees are planted in lawns of apartment buildings and row homes, missing from the map but still bringing just as much joy as those found a few feet away in the city-owned tree boxes.
On a less busy spring day, you might want to explore a new place in search of more flowers and a different view of the blooms. You can even ride a themed train or bus to get there. (Track them online!)
Here’s how many cherry trees are near each Metro stop. Yes, the Mall is the blossom capital of the District. But plenty of other neighborhoods are full of the flowers too, without the crowds. Pick almost any stop outside of downtown D.C. and you’ll find plenty of trees nearby.
Blossoms Near the Metro
| Station | Cherry blossom trees within one half mile |
|---|---|
| Smithsonian Orange, Silver, Blue | 593 |
| Tenleytown-AU Red | 366 |
| Van Ness-UDC Red | 260 |
| Friendship Heights Red | 232 |
| Benning Road Silver, Blue | 211 |
| Minnesota Ave Orange | 199 |
| Waterfront Green | 190 |
| Deanwood Orange | 177 |
| Brookland-CUA Red | 176 |
| Rhode Island Ave Red | 166 |
| Stadium-Armory Orange, Silver, Blue | 164 |
| Cleveland Park Red | 164 |
| Congress Heights Green | 160 |
| Woodley Park Red | 158 |
| Takoma Red | 152 |
| Georgia Ave-Petworth Green | 150 |
| Shaw-Howard U Green | 137 |
| Fort Totten Red, Green | 136 |
| Columbia Heights Green | 126 |
| Foggy Bottom-GWU Orange, Silver, Blue | 121 |
| Potomac Ave Orange, Silver, Blue | 113 |
| Federal Triangle Orange, Silver, Blue | 105 |
| Farragut West Orange, Silver, Blue | 94 |
| U Street Green | 93 |
| Eastern Market Orange, Silver, Blue | 84 |
| Navy Yard-Ballpark Green | 84 |
| Capitol South Orange, Silver, Blue | 83 |
| Anacostia Green | 69 |
| Mt Vernon Sq Yellow, Green | 68 |
| Union Station Red | 54 |
| Dupont Circle Red | 44 |
| Federal Center SW Orange, Silver, Blue | 44 |
| NoMa-Gallaudet U Red | 40 |
| Farragut North Red | 40 |
| Judiciary Square Red | 35 |
| L'Enfant Plaza Orange, Silver, Blue, Yellow, Green | 32 |
| Gallery Place Red, Yellow, Green | 26 |
| Archives Yellow, Green | 23 |
| McPherson Sq Orange, Silver, Blue | 9 |
| Metro Center Red, Orange, Silver, Blue | 9 |
I don’t live in a peak cherry blossom neighborhood, according to the data.
But does it really matter? Are 200 trees so much better than 100 or 50? Seeing 20 trees in full bloom as I walk to buy groceries is still a delight.
In another month or two, when the flowers are long gone and it’s 90 degrees at 8 a.m., I’ll be longing for the return of winter, and then, once again, the blossoms of spring.
How I Built It
Cherry blossom tree locations are from Casey Trees. The dataset does not include trees planted on private property and some parks. Metro route and station locations are from Open Data DC. I incorporated updates from WMATA.
I processed data and created the hexagonal grid map showing tree density using R. The map colors use a logarithmic scale.
I built the interactive map with a stack of open-source tools. I used the DC Master Address Repository API to retrieve addresses for points that readers click on the map. The basemap data is from OpenStreetMap, with tiles generated using Planetiler and processed using Tippecanoe and Protomaps. I built the map with MapLibre and Turf. I styled the base map in part using Maputnik and generated font files with MapLibre's Font Maker using Google Fonts. I built this web page using the Los Angeles Times’ Baker build tool.
View the source code for this page and for the data cleaning and analysis on Github.